 |
| https://water.weather.gov/ahps2/hydrograph.php?wfo=akq&gage=ckhv2 |
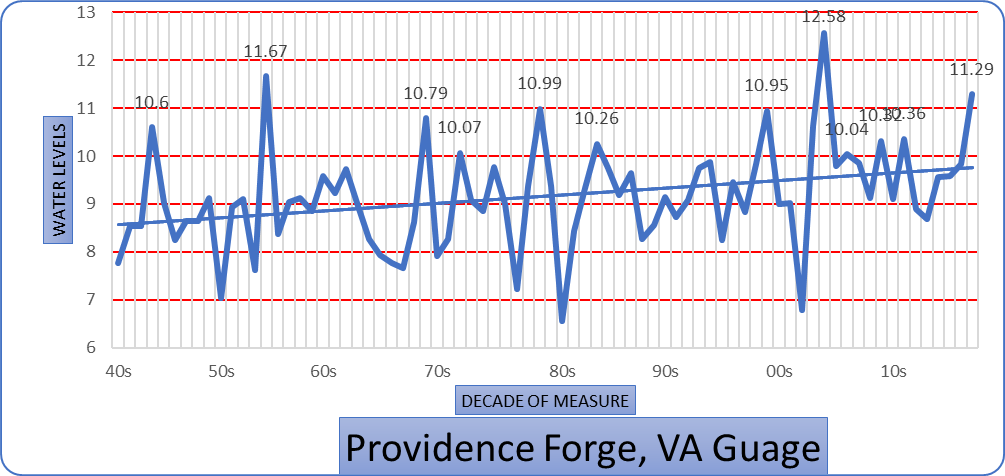
As indicated by the chart above the current water levels are at about 5.5 ft. at the Providence Forge water Gage. This chart also depicts that the water is not considered flooding until it reaches 10 ft. There has been multiple floods occurring since the 40s with the record flood level happening in 2004 with the Gage recorded 12' 6".
 |
Providence Forge Gage House, US Department of Commerce, & NOAA. (n.d.). National Weather Service Advanced Hydrologic Prediction Service. Retrieved September 30, 2018, from https://water.weather.gov/ahps2/hydrograph.php?wfo=akq&gage=ckhv2
Top 20 Historic Crests
(1) 12.58 ft on 09/01/2004
(2) 11.67 ft on 08/15/1955
(3) 11.29 ft on 05/20/2018 (P)
(4) 10.99 ft on 02/27/1979
(5) 10.95 ft on 09/17/1999
(6) 10.79 ft on 07/25/1969
(7) 10.62 ft on 09/22/2003
(8) 10.60 ft on 07/21/1945
(9) 10.36 ft on 09/09/2011
(10) 10.32 ft on 11/15/2009
(11) 10.26 ft on 03/30/1984
(12) 10.07 ft on 06/25/1972
(13) 10.04 ft on 11/19/2006
(14) 9.88 ft on 03/06/1994
(15) 9.86 ft on 04/24/2008
(16) 9.84 ft on 03/22/1998
(17) 9.84 ft on 09/30/2016
(18) 9.79 ft on 09/05/2006
(19) 9.78 ft on 07/17/1975
(20) 9.76 ft on 08/22/1985
|
20 Most Recent Crests
(1) 11.29 ft on 05/20/2018 (P)
(2) 9.84 ft on 09/30/2016
(3) 9.59 ft on 12/27/2015
(4) 9.57 ft on 05/03/2014
(5) 8.63 ft on 06/14/2013
(6) 8.89 ft on 01/19/2013
(7) 10.36 ft on 09/09/2011
(8) 9.19 ft on 08/29/2011
(9) 10.32 ft on 11/15/2009
(10) 9.13 ft on 12/15/2008
(11) 9.86 ft on 04/24/2008
(12) 10.04 ft on 11/19/2006
(13) 9.79 ft on 09/05/2006
(14) 12.58 ft on 09/01/2004
(15) 10.62 ft on 09/22/2003
(16) 6.78 ft on 05/15/2002
(17) 9.03 ft on 04/03/2001
(18) 9.00 ft on 04/19/2000
(19) 10.95 ft on 09/17/1999
(20) 9.84 ft on 03/22/1998
|
US Department of Commerce, & NOAA. (n.d.). National Weather Service Advanced Hydrologic Prediction Service. Retrieved September 30, 2018, from https://water.weather.gov/ahps2/hydrograph.php?wfo=akq&gage=ckhv2
Looking over these numbers it may it difficult to see if there were any trends. So I created the chart below to be able to better demonstrate an increasing amount of flood trends over the previous 20 years. Looking at the chart below you can see a steady increase in the levels of water and an increase in the 10ft flood levels. From 1999 to present day there were 6 floods compared to 6 in the previous 50 years. For this chart I only looked at the events that recorded 9 ft or greater.
|


No comments:
Post a Comment